

Like many in our industry, the team here at Petro.ai keeps a close eye on oil prices, rig count, and analyst reports to stay in tune with what's happening. Richard Gaut, our CFO, and I were discussing the recent trends in the rig count which led us to dive into the data. Essentially, we were curious as to how different types of E&P's are adjusting their activity in the current market. There's been a lot of news recently on how the super-majors are now finally up to speed in unconventionals and that smaller operators won't be able to compete.
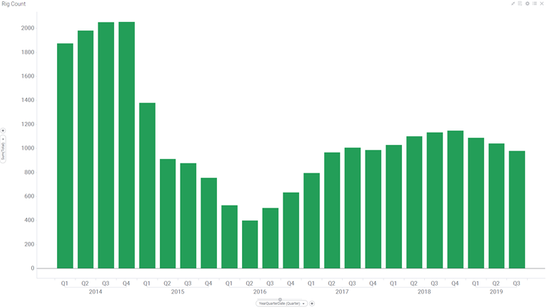
Figure 1: North American Rig Count (from BakerHughes) The figure above shows the North American rig count from BakerHuges and we can see the steady recovery from mid-2016 through 2018, followed by another decline in 2019. But has this drop been evenly distributed among operators? TPH provides a more detailed breakdown of the rig count, segmenting the rigs by operator. I put the operators into one of three buckets:
- Large-cap and integrated E&P's
- Mid-cap and small-cap publicly traded E&P's
- Privately held E&P's
The figure below shows the breakdown between these three groups overlaid with the total rig count. You can see the mid and small caps in yellow are a shrinking segment. Figure 3 shows these groups as percentages and makes the divergence between the groups extremely visible.
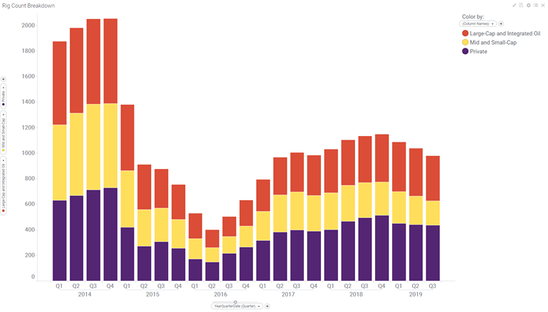
Figure 2: Rig count segmented by operator type
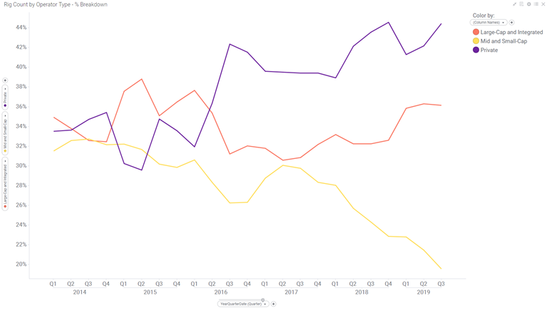
Figure 3: Percentage breakdown of rigs by operator type Since the recovery in 2016, privately held companies have taken on a larger share of the rigs and that trend continues through the recent downturn in 2019. This is likely because they are tasked by their financial backers to deploy capital and have no choice but to keep drilling. The large-caps and integrated oil companies have been staying constant or growing slightly since mid-2016 as has been reported. These operators have deep pockets and can offset losses in unconventionals with profits made elsewhere – at least until they become profitable. The story is very different for the small and mid-caps. These operators have experienced the sharpest drop in activity as they are forced by investors to live with in their cash flows. The data used in this analysis were pulled at the end of September. We typically see a slowdown in activity in Q4 and recent news shows that this slowdown might be worse than normal. It's likely the divergence we see will only continue through the end of the year. Next, I split out the rig count by basin and found some interesting trends there which I'll elaborate on in a second blog post.


